When throughput drops, the instinct is to check the machines. The actual cause is usually three layers up.
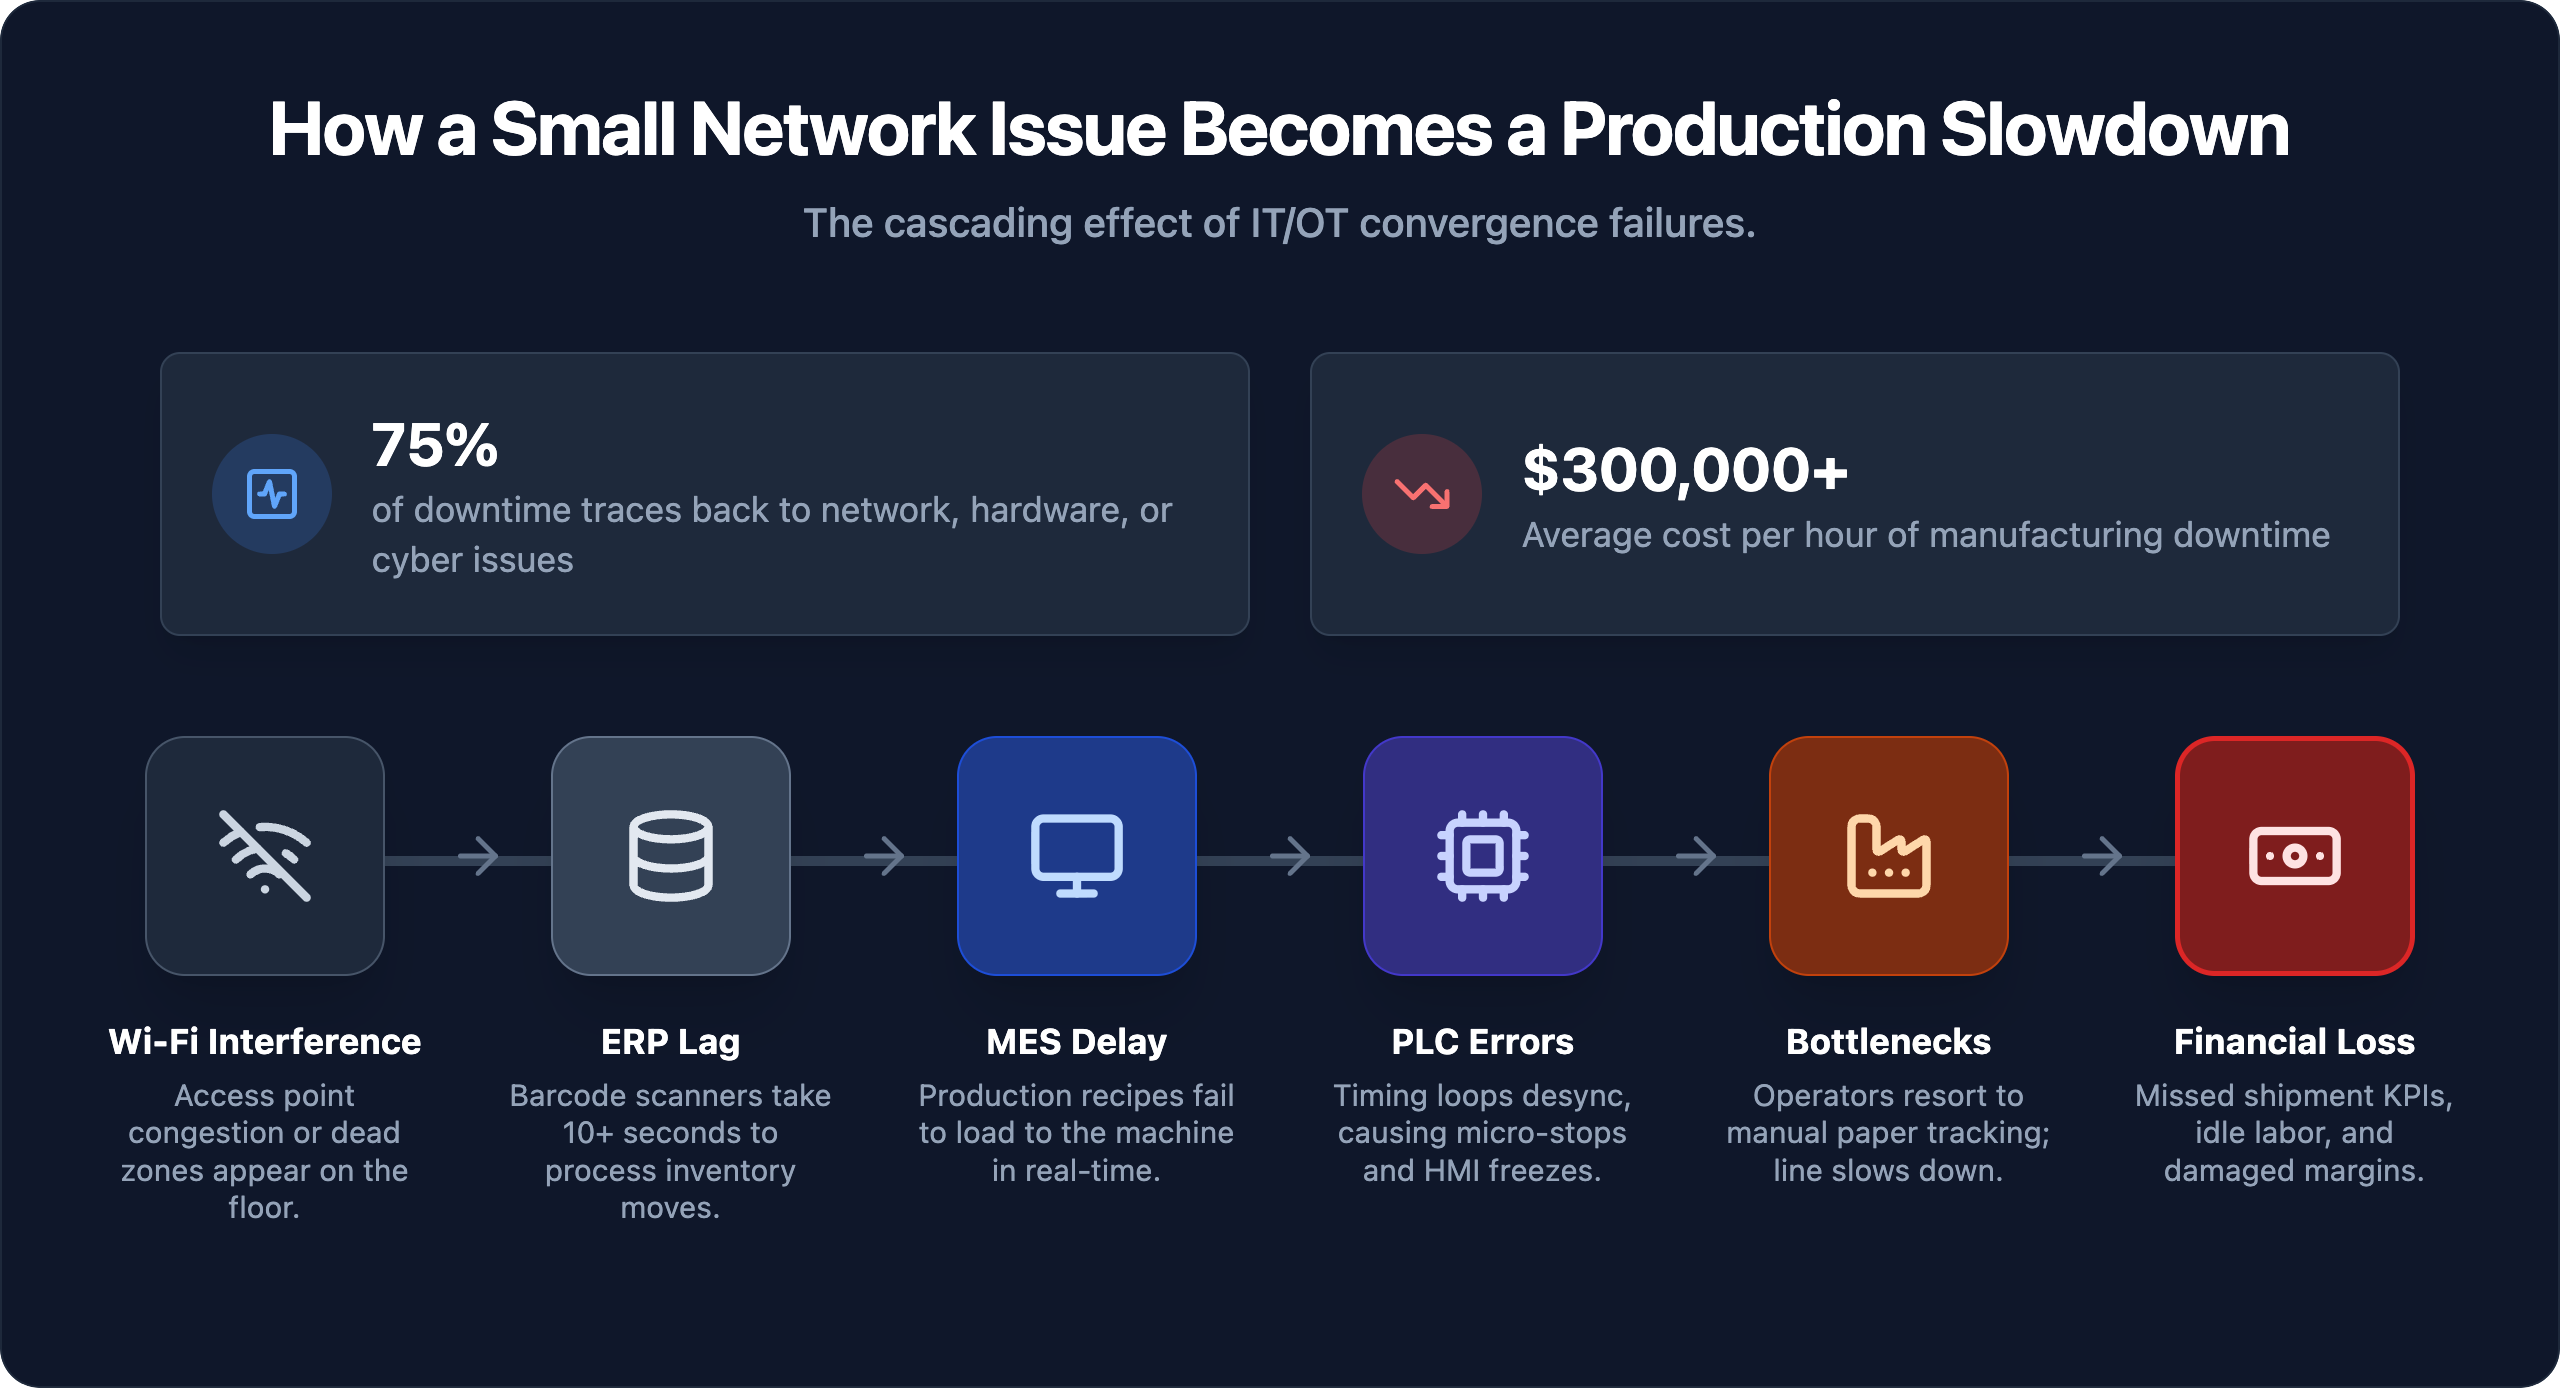
More than 90% of mid-sized and large manufacturers now face hourly downtime costs exceeding $300,000 — and a growing share of those events trace back to software, network infrastructure, or control system failures, not mechanical breakdowns. Your ERP is running behind. Your network is saturated. Your PLCs haven’t been patched since the last administration. None of these conditions trips an alarm. They just quietly bleed your output until a supervisor notices the line is running wrong.
Manufacturing operations have become software-dependent at every layer. Scheduling runs through ERP. Quality checks flow through MES. Line controllers depend on network communication to function. When any one of those layers degrades — even partially — the impact lands on your floor as idle workers, missed shipments, and decisions made on stale data.
Most operations leaders are trained to respond to outages: the line stops, the alarm sounds, the response protocol kicks in. Slowdowns are a more insidious problem — because production keeps moving while performance quietly erodes.
A manufacturing system slowdown is any condition where performance degrades enough to reduce throughput, delay decision-making, or introduce errors into the production process without triggering a full stop. The distinction from a complete outage matters because slowdowns rarely activate emergency protocols. They accumulate across shifts, weeks, and quarters before anyone quantifies the damage.
Hidden downtime costs in manufacturing regularly exceed direct production losses by 200% to 300%. The financial exposure from a persistent slowdown often dwarfs what shows up on any incident report.
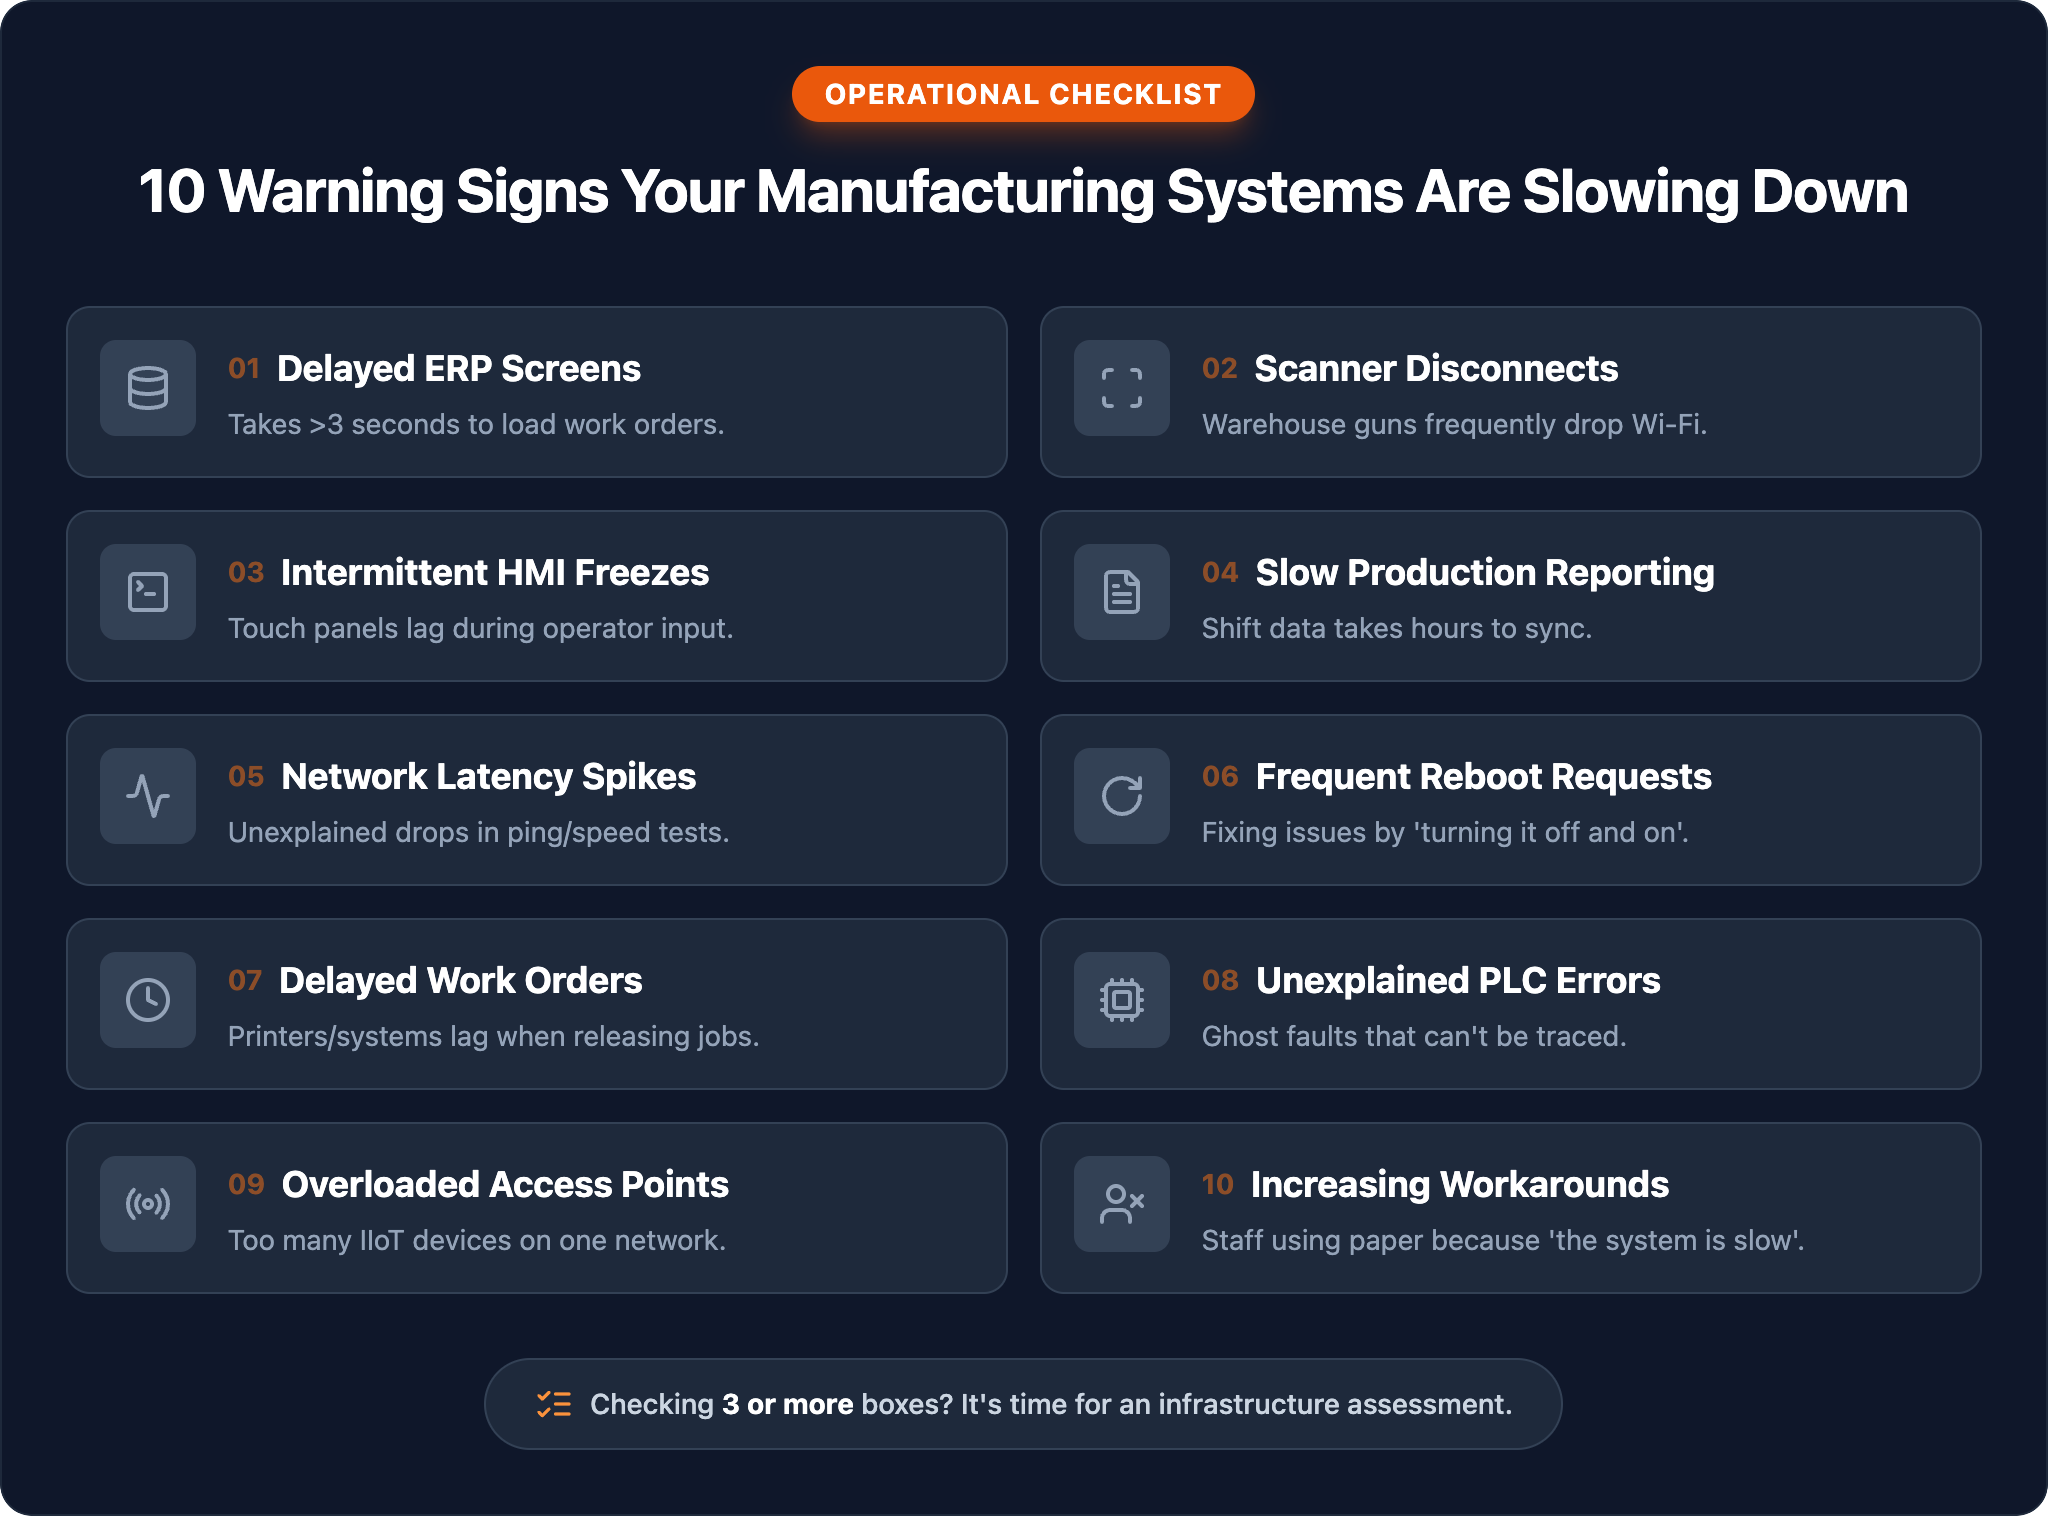
In practice, slowdowns surface across several interconnected layers:
None of these conditions shut your facility down. All of them reduce output, increase scrap rates, strain scheduling, and put customer commitments at risk.
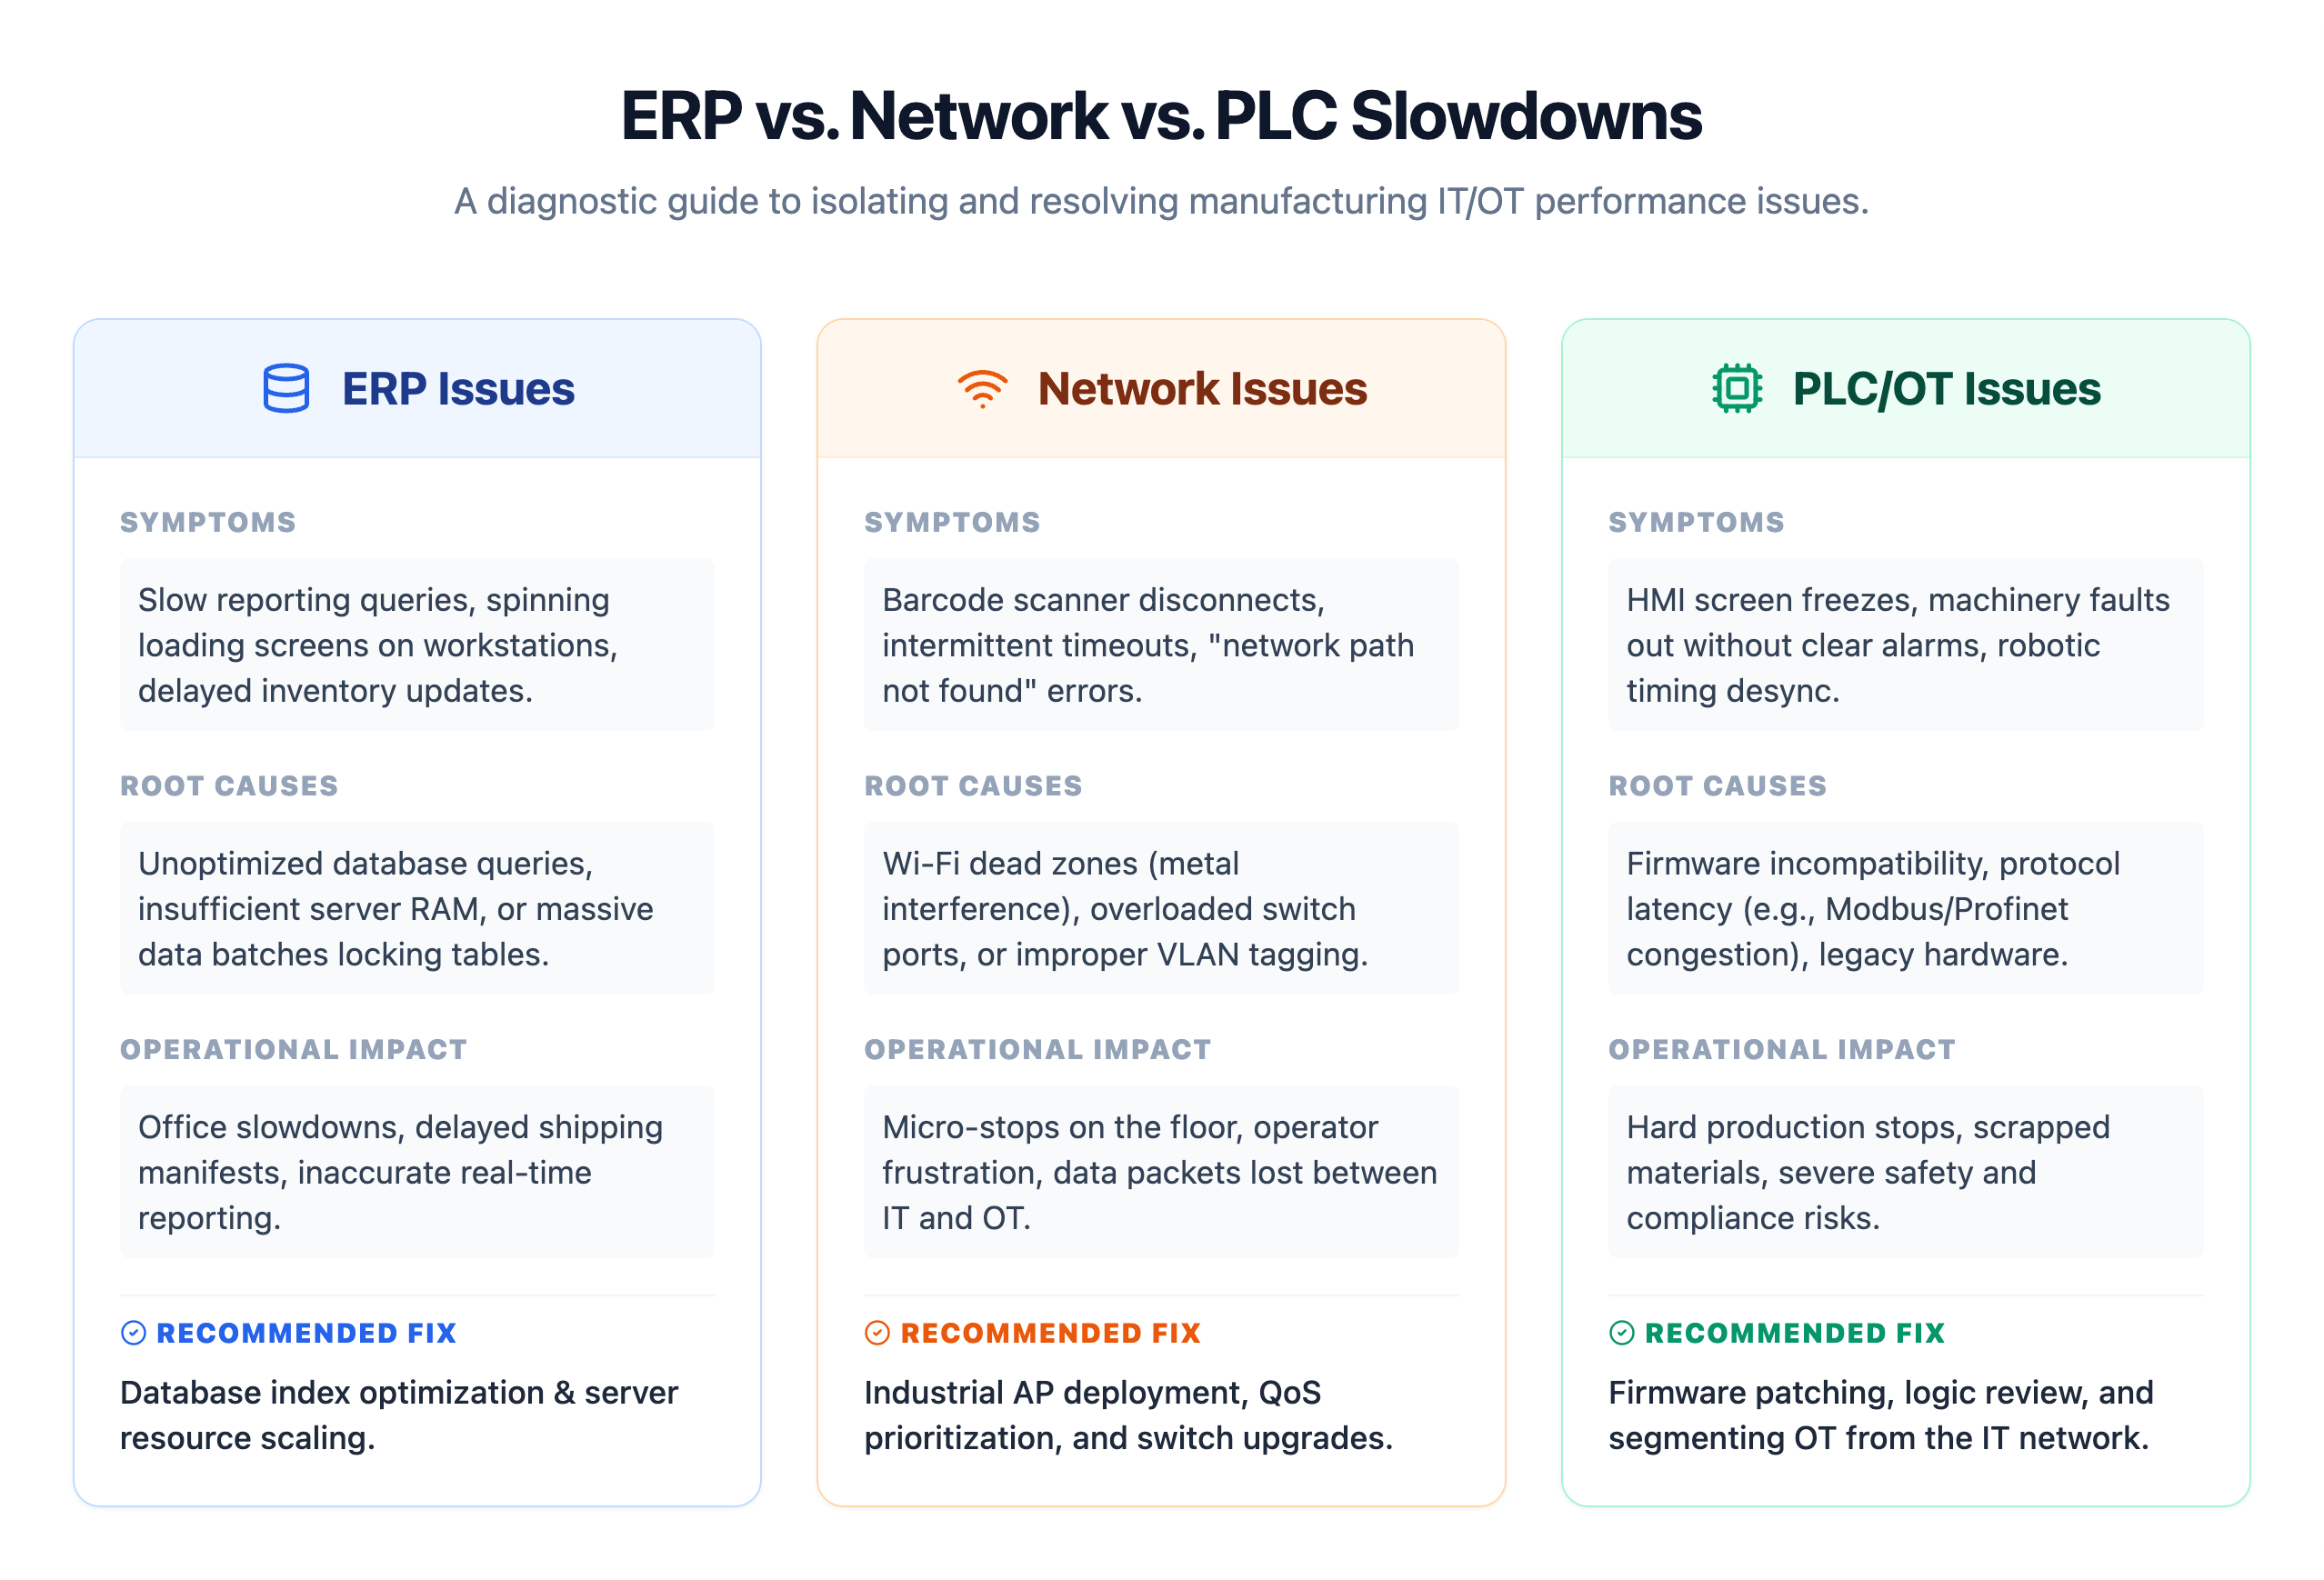
The instinct on most plant floors is to look at what’s visible: the operator who paused the line, the scanner that stopped reading, the printer that jammed. Plant managers are trained to find and fix physical bottlenecks, so when throughput drops, the investigation starts on the floor.
The problem: 75% of manufacturing IT downtime events trace back to network and connectivity issues, cybersecurity incidents, or aging hardware — not equipment failures or operator error. Misattributing the cause doesn’t just delay the fix; it sends maintenance teams chasing problems that don’t exist while the actual failure point continues degrading.
Each symptom presents at the operational layer. The root cause sits in the IT or OT infrastructure underneath. Without visibility into both layers simultaneously, the troubleshooting loop repeats: operators get blamed, equipment gets swapped out, and the underlying condition persists.
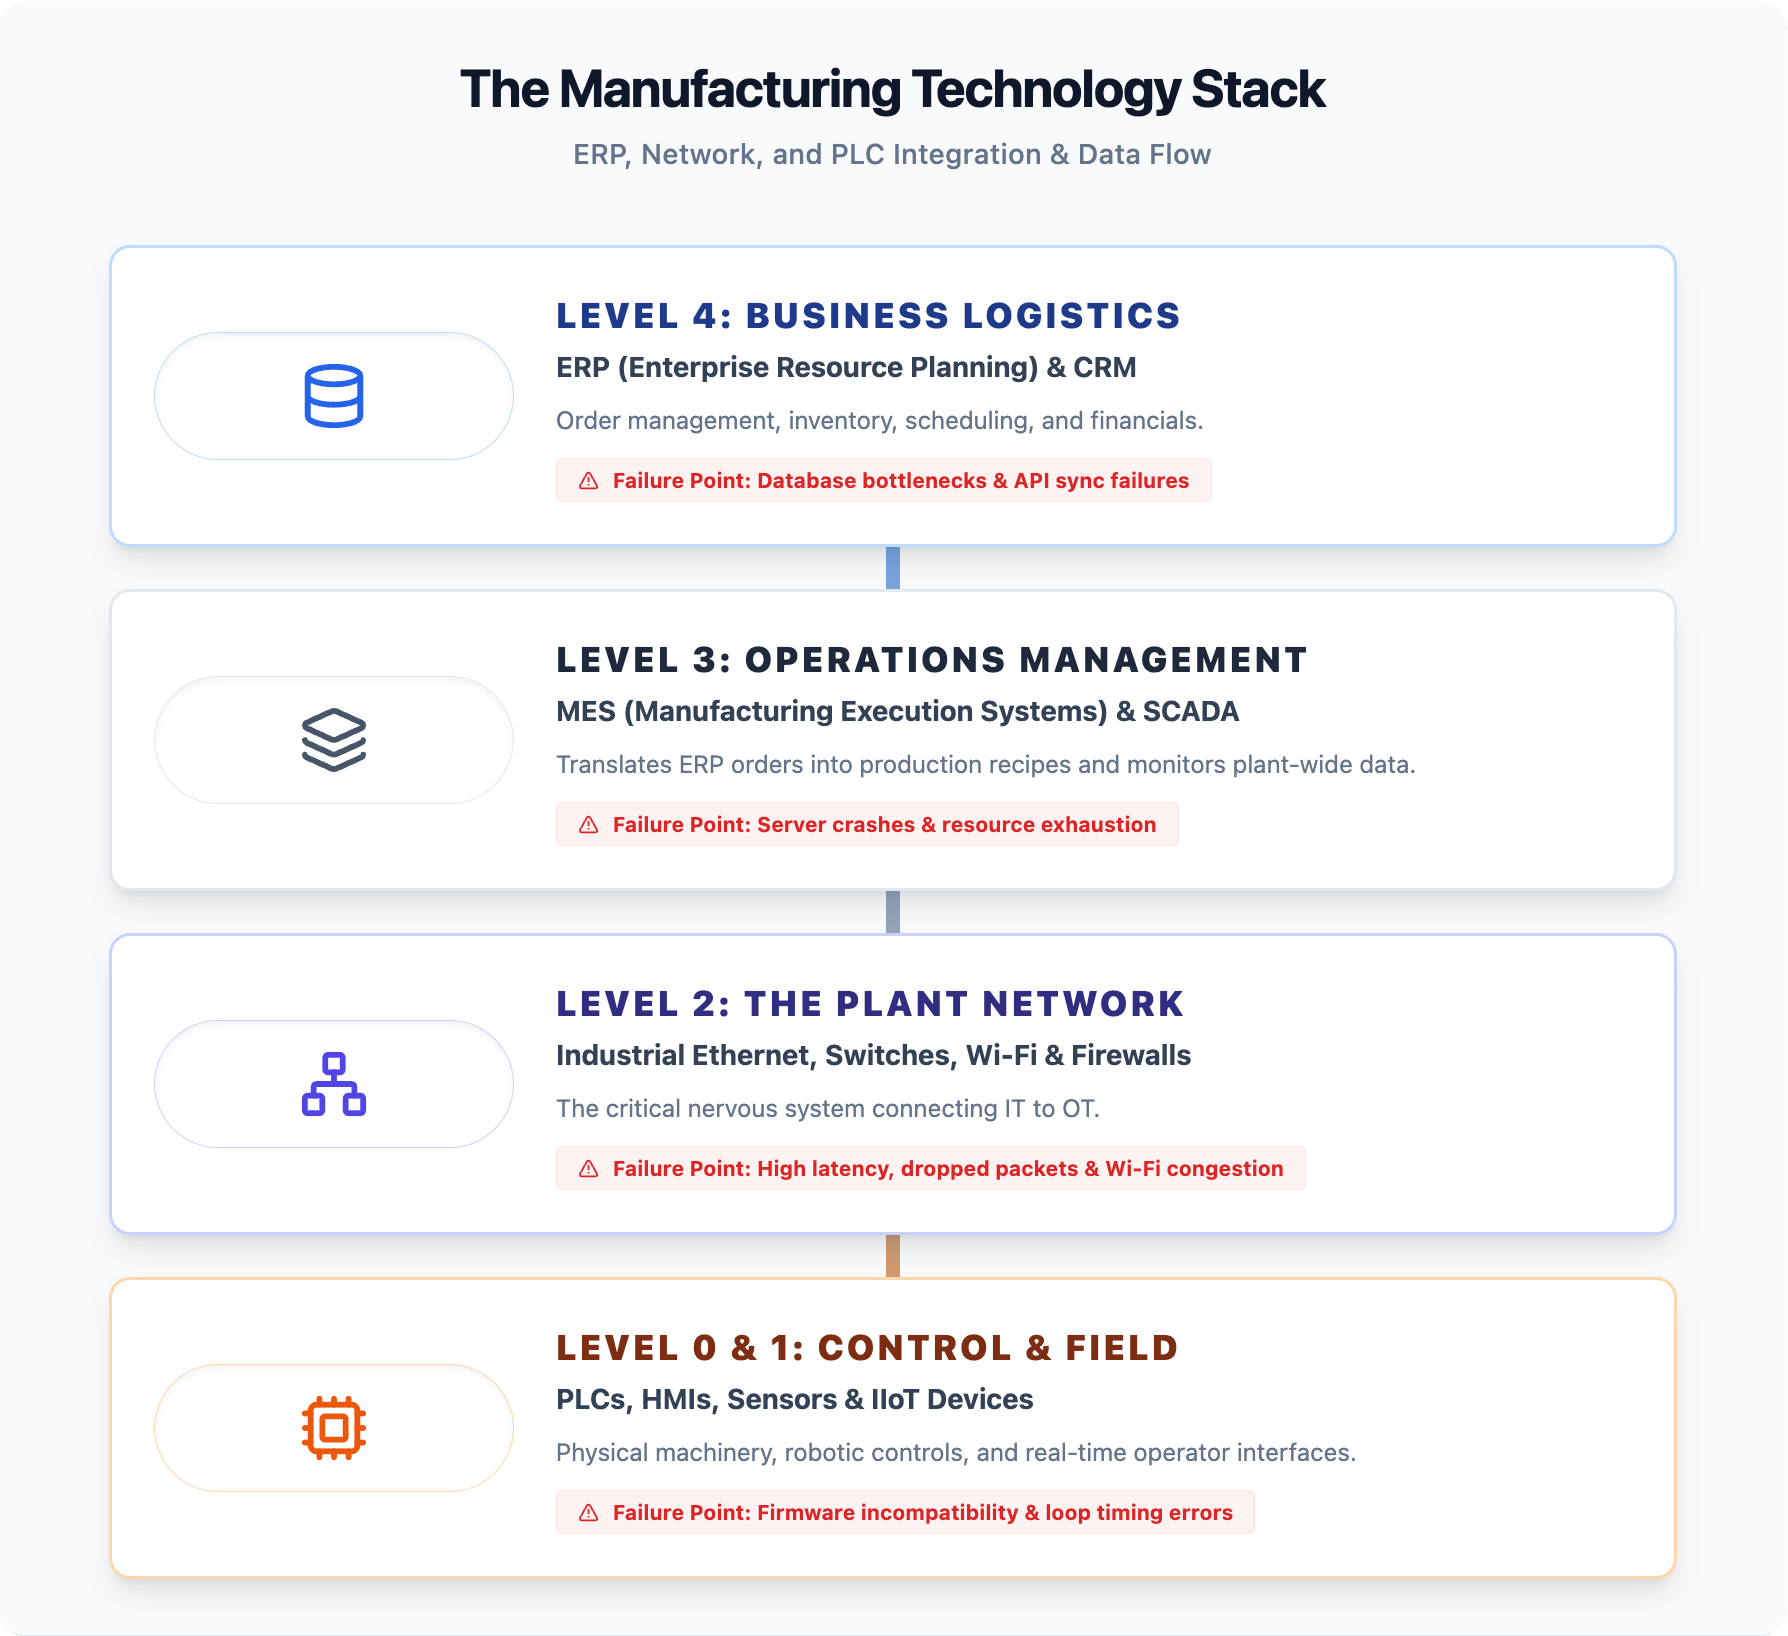
Modern manufacturing runs on three interdependent technology layers. Understanding how they interact is the foundation for diagnosing any slowdown.
At the top sits the enterprise layer: ERP and MES platforms managing scheduling, inventory, work orders, and quality. Below that runs the plant network infrastructure connecting every device on the floor. At the operational edge sit PLCs, HMIs, and SCADA systems that directly control machinery. These layers exchange data continuously — and a failure or degradation in any one propagates through the others within minutes.
| Layer | What It Controls | What Fails When It Degrades |
|---|---|---|
| ERP / MES | Scheduling, inventory, work orders, quality | Production orders stall, operators work on stale data |
| Network | All floor communications | Every connected system degrades simultaneously |
| PLC / SCADA / HMI | Machine logic, line control, real-time monitoring | Timing errors, line faults, lost production visibility |
The convergence of IT and OT has eliminated the buffer that once separated these layers. A routine backup job, a misconfigured switch, or a saturated access point can now inject enough latency into a PLC communication loop to cause a line fault. Only 5% of organizations report full visibility across both their OT and cybersecurity environments — which means most manufacturers are operating with significant blind spots precisely where the risk is highest.
Years of accumulated transaction records, unarchived historical data, and deferred maintenance compound into slower query execution and longer page load times. Most mid-sized manufacturers never implement a formal data lifecycle policy, so ERP databases grow without bounds until response times become operationally disruptive.
Poorly configured middleware and API connections between ERP and MES platforms force duplicate data processing and introduce sync delays. When the shop floor and the business system are out of step, production decisions get made on stale data, and reconciliation processes consume additional system resources.
ERP workloads grow as transaction volumes, user counts, and data complexity increase. Legacy on-premises servers provisioned five or more years ago do not scale with that growth. With manufacturing IT downtime costs ranging from $50,000 to $250,000 per hour, the cost of deferred hardware investment is rarely justified by the capital savings.
Custom code built to accommodate unique workflows creates technical debt that compounds with every ERP update. Compatibility conflicts slow system performance and make patching cycles longer and riskier.
End-of-shift reporting, month-end closes, and ad hoc queries run by multiple users simultaneously compete with live production transactions for server resources. Without query governance or scheduled reporting windows, peak-hour performance degrades precisely when operational visibility matters most.
Steel structures, overhead cranes, and high-density machinery create RF interference and signal dead zones. When handheld scanners, mobile workstations, or wireless HMIs lose connectivity mid-transaction, operators experience freezes and timeouts that halt production workflows entirely.
Network hardware running beyond its rated lifecycle introduces packet loss and port-level bottlenecks. Every connected system — from ERP terminals to SCADA interfaces — degrades in response time as aging infrastructure fails to sustain throughput under production load.
Quality of Service (QoS) is the mechanism that assigns traffic priority across a network. Without QoS configured, backup jobs, software updates, and video feeds compete equally with production-critical ERP queries and PLC communications. Production applications lose that competition during peak demand.
Improper segmentation creates two distinct failure modes: broadcast storms that flood the network with unnecessary traffic, and misconfigured access controls that block legitimate communication between production systems. Both present on the floor as unexplained intermittent failures that appear random.
Cloud-connected ERP platforms, vendor remote access, and SaaS-based MES systems require continuous internet connectivity to function. A single ISP outage without a failover circuit brings those systems to a complete stop, regardless of how well the internal network performs.
Legacy firmware creates compatibility gaps as surrounding systems are updated. An unpatched controller introduces timing errors, communication failures with newer devices, and security exposures that degrade both performance and reliability over time — often without surfacing a clear alarm.
Modbus, EtherNet/IP, and Profinet each carry specific timing and bandwidth assumptions. When traffic volumes exceed those assumptions or protocol configurations are mismatched across devices, polling delays and dropped packets accumulate into measurable production lag.
When HMI-to-PLC communication times out, operators lose real-time line visibility, alarms go unacknowledged, and production decisions get made on stale data. The result is not a clean shutdown — it’s a degraded, error-prone operating state that accumulates scrap and scheduling errors across the shift.
Adding sensors and edge gateways without architecting the underlying data flows overloads controllers with polling requests and telemetry traffic they were not designed to handle at that volume. Growth in connected devices without corresponding infrastructure design is one of the most common and underreported causes of progressive performance degradation.
Manufacturing has been the most targeted industry for ransomware for three consecutive years. Malware that crosses from IT into OT environments doesn’t just lock files — it disrupts control logic, severs communication between systems, and forces production shutdowns that can last days. A single OT security failure can convert into a six-figure loss within 72 hours.
Identifying the responsible layer requires a structured methodology, not guesswork. Without a repeatable diagnostic process, operations teams waste hours chasing symptoms while the actual source continues degrading throughput.
Step 1 — Map every production-critical dependency. Document every system, device, and connection that production relies on: ERP, MES, network switches, firewalls, edge gateways, and PLCs. This dependency map becomes the framework for every diagnostic step that follows.
Step 2 — Capture symptoms by layer and time. Record exactly when slowdowns occur, which devices are affected, and whether timing correlates with specific events — shift changes, end-of-day report generation, ERP batch processing windows. Patterns tied to specific activities almost always point to application-layer or scheduling conflicts rather than hardware failure.
Step 3 — Review network and application performance data. Examine latency trends, packet loss rates, and application response times across the affected period. Given that 75% of manufacturing IT downtime events trace back to network and connectivity issues, this layer deserves rigorous scrutiny before assuming the ERP or PLC is at fault.
Step 4 — Test each layer independently. Isolate layers through targeted load testing and direct device queries. If a PLC responds normally when the network path to the ERP is bypassed, the bottleneck is above the control layer. If ERP response times degrade only during specific transactions, the issue is application or database related, not infrastructure.
Step 5 — Correlate findings against recent changes. Software updates, new devices added to the network, firewall rule modifications, and vendor remote access sessions are among the most common triggers for slowdowns that appear unrelated at first. A change log reviewed alongside performance data often closes the diagnostic gap faster than any tool alone.
The root causes covered in this guide — ERP bottlenecks, network congestion, PLC failures, and IT/OT integration gaps — share a common thread: they are detectable before they become production emergencies. The gap between manufacturers who experience chronic slowdowns and those who don’t is rarely a technology gap. It’s a visibility and response gap.
Book an IT Assessment with IT GOAT →
We’ll identify the specific vulnerabilities inside your environment — across ERP, network, and control system layers — before they translate into unplanned downtime costs.
Yes. When an ERP or MES system lags, work order data reaches PLCs and HMIs late or out of sequence. Operators wait for instructions that haven’t arrived, machines idle between job transitions, and supervisors lose real-time production visibility. The ERP doesn’t have to go fully offline to create downstream disruption at the control layer.
Start with the network. A modern ERP running on degraded infrastructure will underperform regardless of its capabilities. Diagnose the bottleneck layer before committing capital to application upgrades. In many cases, network remediation resolves the symptoms that were being attributed to the ERP.
Response must be measured in minutes. With manufacturing IT downtime costs ranging from $50,000 to $250,000 per hour, every delay in acknowledgment compounds the financial exposure. A 20-minute human response standard is achievable and should be a contractual baseline, not an aspirational target.
Not necessarily separate teams, but whoever manages these environments must understand both IT and OT contexts. A managed partner with documented OT expertise can bridge that gap effectively for facilities that can’t justify dedicated headcount.
At minimum annually, with continuous monitoring active between formal assessments. Degradation rarely announces itself abruptly — it accumulates across shifts and weeks until a threshold is crossed. By the time the audit catches it, the cost is often already absorbed.
We use cookies to enhance site performance and user experience. Your data stays private — we don’t sell your information or share it with unrelated third parties. To find out more about the cookies we use, view our Privacy Policy.